Unfortunately my family and I live in a country that doesn’t have the greatest air quality. In order to see how bad it really is I have decided to pull out the Raspberry Pi yet again. Once attached to a Particle Matter sensor I’ll have my own basic Air Quality/Weather station. This somewhat flows on from my previous series – Raspberry Pi and Motion (Weather App Pt 2) (Revised).
Particulate Matter and Air Quality Index
Air Quality Index (AQI) serves as a crucial tool to convey the current level of air pollution. Health risks increase as the AQI rises. The common pollutants tracked by AQI include ground-level ozone, particulate matter, carbon monoxide, sulfur dioxide, and nitrogen dioxide.
Particulate matter (PM) refers to a mixture of solid particles and liquid droplets found in the air. Particulate matter can be categorized based on the size of the particles:
- PM1.0 refers to particles that are 1.0 micron or smaller in diameter. These particles are so small that they can penetrate the lungs and may even enter the bloodstream, posing significant health risks.
- PM2.5, also known as fine particulate matter, includes particles that are 2.5 microns or smaller in diameter. Because of their size, they can penetrate deep into the lung tissue and have been linked to a variety of health problems, from minor eye and throat irritation to more serious conditions such as heart attacks and decreased lung function.
- PM10 includes particles that are 10 microns or smaller in diameter. These particles can cause health issues by irritating the eyes, nose, and throat, and can affect the heart and lungs, making pre-existing lung and heart conditions worse.
Components Required
So, to get started, here is a short list of the key components you’ll need – at the very least – to get this small project up and running.
- Raspberry Pi Zero 2 W (also tested and working on the Raspberry Pi 4 Model B and original Model B)
- PMS5003 Particulate Matter Sensor w/ Breakout Board
- PMS5003 Particulate Matter Sensor (I have also had success with this sensor and breakout from Pimoroni)
- Particulate Matter Sensor Breakout
- BME680 Sensor Temperature, Pressure, and Humidity Sensor (Not necessary but can also provide useful additional data)
- Jumper Cables – Extremely useful for connecting the sensors to the Raspberry Pi
I went with the Raspberry Pi Zero because the end goal of this is to stick it outside in a weatherproof enclosure so space will be a limiting factor in the final revision. Key an eye out for future parts where I do that as well as try my hand at PCB design for the ultimate Weather HAT (Hardware Attached on Top).
Raspberry Pi Wiring Guide
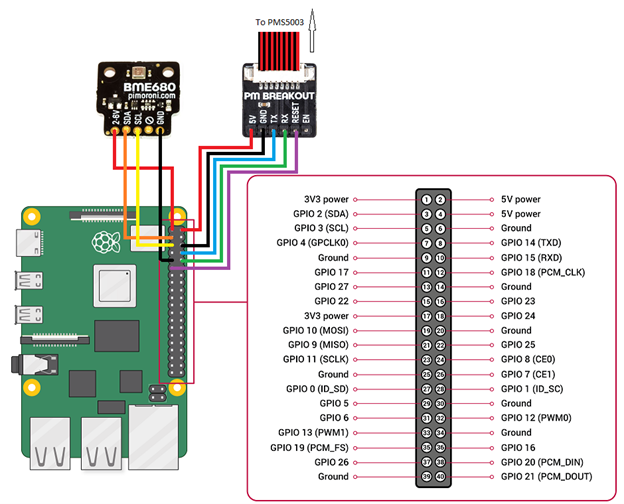
Fortunately for us, the wiring for this project is super straight forward. No additional resistors will be required so it’s as simple as attaching the pins of the sensor to the corresponding pins on the Raspberry Pi.
The two tables below show the pin-out from the sensor boards and the pin that it will be plugged into on the Pi.
| Raspberry Pi GPIO Pin | PMS5003 Breakout Board |
| Pin #2 5v | Pin #1 5v |
| Pin #6 Ground | Pin #2 GND |
| Pin #8 GPIO 14 (TXD) | Pin #3 TX |
| Pin #10 GPIO 15 (RXD) | Pin #4 RX |
| Pin #11 GPIO 17 | Pin #5 Reset |
| – | Pin #6 EN |
| Raspberry Pi GPIO Pin | BME680 Breakout Board |
| Pin #1 3.3v | Pin #1 2-5v |
| Pin #3 GPIO 2 SDA | Pin #2 SDA |
| Pin #5 GPIO 3 SCL | Pin #3 SCL |
| – | Pin #4 N/A |
| Pin #9 Ground | Pin #5 GND |
And here is a simple diagram for those who are more visually inclined!
Software Installation
Raspberry Pi Setup
Firstly, you will need to enable I2C and Serial Port Interfaces on the Pi. Do this by opening the configuration screen:
sudo raspi-configChoose ‘Interface Options’ and do the following:
- Enable I2C
- Serial Port – Disable Login Shell
- Serial Port – Enable Serial Port Hardware
Next, we need to manually adjust some of the other config settings of the Pi.
sudo nano /boot/config.txtAdd the following lines to the bottom in order to adjust the communication rate of the I2C interface, and switch the Bluetooth functionality of the Raspberry Pi to mini UART.
dtparam=i2c_arm_baudrate=10000
enable_uart=1
dtoverlay=pi3-miniuart-btSave the file (Ctrl+x) and reboot the device.
sudo rebootOnce rebooted we can then install Python and a few essential pieces of software in order to communicate programmatically with the sensors.
sudo apt install build-essential git i2c-tools python3-dev python3-setuptools python3-venv python3-requests python3-smbus python3-serial python3-tzI always recommend creating a virtual environment for new projects because it keeps everything a little more segregated and reduces the risks of conflicts and other issues.
Environment Setup
mkdir weather && cd weather
python3 -m venv .venv
source .venv/bin/activateNow let’s install python libraries for the PMS5003 and BME680 sensors
pip install pms5003 adafruit-circuitpython-bme680 adafruit_extended_busTesting
Let’s create a couple of python files now in order to use these libraries to connect and read the data coming from the sensors:
nano pmSensor.pyfrom pms5003 import PMS5003
pms5003 = PMS5003(device="/dev/ttyAMA0", baudrate=9600, pin_enable="GPIO22", pin_reset="GPIO27")
data = pms5003.read()
print(data)Save the file and then run it.
python3 pmSensor.pyAnd you should see the following output:
PM1.0 ug/m3 (ultrafine particles):                             35
PM2.5 ug/m3 (combustion particles, organic compounds, metals): 53
PM10 ug/m3  (dust, pollen, mould spores):                      55
PM1.0 ug/m3 (atmos env):                                       28
PM2.5 ug/m3 (atmos env):                                       43
PM10 ug/m3 (atmos env):                                        51
>0.3um in 0.1L air:                                            5892
>0.5um in 0.1L air:                                            1656
>1.0um in 0.1L air:                                            324
>2.5um in 0.1L air:                                            25
>5.0um in 0.1L air:                                            1
>10um in 0.1L air: 0Next, for the BME680 sensor
nano bme680.pyimport adafruit_bme680
import time
import board
from adafruit_extended_bus import ExtendedI2C as I2C
i2c = I2C(1)
bme680 = adafruit_bme680.Adafruit_BME680_I2C(i2c)
# Change this to the pressure at sea level in your location
bme680.sea_level_pressure = 1002.25
temp = "%0.1f" % bme680.temperature
humidity = "%0.1f" % bme680.relative_humidity
pressure = "%0.3f" % bme680.pressure
altitude = "%0.2f" % bme680.altitude
data = {
'Temperature': temp,
'Pressure': pressure,
'Humidity': humidity,
'Altitude': altitude
}
print(data)Save it and run it:
python3 bme680.pyAnd the output will appear as follows:
{'Temperature': '34.0', 'Pressure': '681.287', 'Humidity': '100.0', 'Altitude': '19.72'}I have found that I have to run the BME680 sensor script 3-4 times before it gives me consistent (and I assume) accurate readings.
AirQualityPi Project
As discussed earlier, this is part of a bigger project which I’ve dubbed AirQualityPi. The idea is to read these sensors several times per hour and store the data. This data can then be displayed on a web dashboard in order to view current values as well as weekly, monthly, and yearly trends as data is gathered.
All of this data flow will be handled via an API (both reading and writing) which I’ll discuss in a later post. You can view the AirQualityPiSensor code over on my GitHub, and keep an eye out for my future posts where I’ll go over the rest of the project.